File:Phase diagram of water.png
Jump to navigation
Jump to search

Size of this preview: 710 × 599 pixels. Other resolutions: 284 × 240 pixels | 2,000 × 1,688 pixels.
Original file (2,000 × 1,688 pixels, file size: 811 KB, MIME type: image/png)
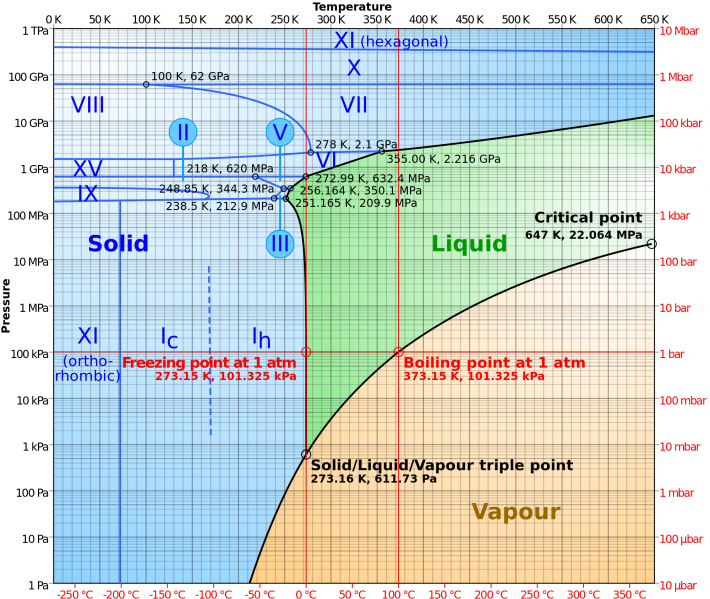
Phase diagram of water as a log-lin chart with pressure from 1 Pa to 1 TPa and temperature from 0 K to 650 K, compiled from data in [1] and [2]. Note that the phases of Ice X and XI (hexagonal) differ from the diagram in [3] Source: Cmglee
Licensing
| This file does not have information about its copyright status. Due to the Scioly.org Wiki's CC-BY-SA 3.0 license, files must meet certain copyright standards in order to exist on the wiki. To the uploader: If you have any more information about the source of this file, please edit this page to include that information. A staff member will review this file soon and will help determine the copyright status of this file. If it does not comply with the wiki's copyright policy, the file may unfortunately have to be removed. If the file does meet the wiki's standards, the license for the file will be updated. If this copyright issue is not solved by June 01 2022, the file will be deleted. For staff - a step by step process for solving copyright issues:
|
File history
Click on a date/time to view the file as it appeared at that time.
| Date/Time | Thumbnail | Dimensions | User | Comment | |
|---|---|---|---|---|---|
| current | 15:46, 27 February 2015 | | 2,000 × 1,688 (811 KB) | Finagle29 (talk | contribs) | Phase diagram of water as a log-lin chart with pressure from 1 Pa to 1 TPa and temperature from 0 K to 650 K, compiled from data in [http://www.lsbu.ac.uk/water/phase.html] and [http://ergodic.ugr.es/termo/lecciones/water1.html]. Note that the phases o... |
You cannot overwrite this file.
File usage
The following page uses this file: