Adi1008 wrote:There's one slight thing that made me hesitant to answer though that I want to bring up too. Looking at the blips in your picture, they seem to come at intervals of 5 transits, making it seem like the ratio of orbits and star's rotations is 5:1. However, according to Bécky et al. this ratio should be 6:1 (http://arxiv.org/pdf/1403.7526v1.pdf), as illustrated by Figure 3 on page 3. It shows various transit light curves, with every sixth light curve having the same sunspot. Similarly, in Figure 6, there's a big spike in the height of the bar every 6th transit. Although a minor detail, this actually threw me off a lot because I assumed that it must have been a different star. Do you know anything about this, or is it just a differeing result from experimentation?
I have in my notes that it is 6:1, not 5:1. I also have that the sunspots shift in positions which is why only some light curves have the sunspots, and that the shifting positions is likely similar to the butterfly diagram of the sun (I assume you know more about this than I do since you did Solar System). Besides that, I don't know, maybe you found a flaw in their research? I'll leave it to syo_astro if he would know anything about this.
1. Faster
2. Before, since they accrete mass faster
3a. Frost line
3b. Past the frost line, volatile 'gasses' are solid and can accrete into planetesimals whereas before the frost line they cannot
3c. Negative, since gas giants are the heaviest type of planet and they typically consist primarily of hydrogen and helium
3d. Positive, since although gas giants have lower metallicities than terrestrial planets and ice giants, they have large metallic cores heavier than terrestrial planets
4. A higher surface density correlates to higher planetesimal mass and faster planetesimal growth
Re: Astronomy C
Posted: April 22nd, 2016, 3:41 pm
by Adi1008
Magikarpmaster629 wrote:
Adi1008 wrote:There's one slight thing that made me hesitant to answer though that I want to bring up too. Looking at the blips in your picture, they seem to come at intervals of 5 transits, making it seem like the ratio of orbits and star's rotations is 5:1. However, according to Bécky et al. this ratio should be 6:1 (http://arxiv.org/pdf/1403.7526v1.pdf), as illustrated by Figure 3 on page 3. It shows various transit light curves, with every sixth light curve having the same sunspot. Similarly, in Figure 6, there's a big spike in the height of the bar every 6th transit. Although a minor detail, this actually threw me off a lot because I assumed that it must have been a different star. Do you know anything about this, or is it just a differeing result from experimentation?
I have in my notes that it is 6:1, not 5:1. I also have that the sunspots shift in positions which is why only some light curves have the sunspots, and that the shifting positions is likely similar to the butterfly diagram of the sun (I assume you know more about this than I do since you did Solar System). Besides that, I don't know, maybe you found a flaw in their research? I'll leave it to syo_astro if he would know anything about this.
1. Faster
2. Before, since they accrete mass faster
3a. Frost line
3b. Past the frost line, volatile 'gasses' are solid and can accrete into planetesimals whereas before the frost line they cannot
3c. Negative, since gas giants are the heaviest type of planet and they typically consist primarily of hydrogen and helium
3d. Positive, since although gas giants have lower metallicities than terrestrial planets and ice giants, they have large metallic cores heavier than terrestrial planets
4. A higher surface density correlates to higher planetesimal mass and faster planetesimal growth
You got everything exactly right! Nice job, your turn
Re: Astronomy C
Posted: April 22nd, 2016, 5:55 pm
by Magikarpmaster629
Good luck at state, Adi! I hope to see you at nationals!
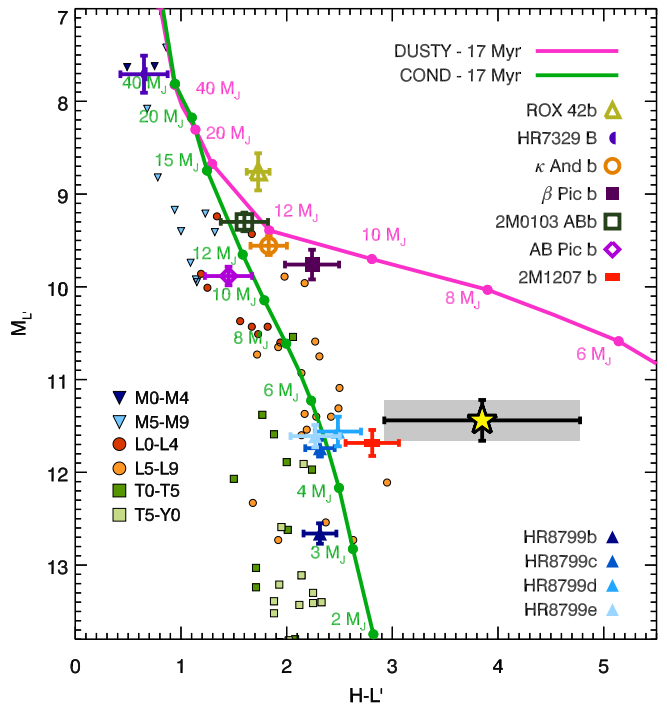
1. What type of diagram is this?
2. What data is plotted (what types of objects)?
3. Beta Pictoris b most likely belongs to what spectral class?
4. What do the green and pink lines represent, and which one does the data shown fit better?
5. How many times brighter is 2MASS-0103 AB b than HR 8799 b in the L' band?
Re: Astronomy C
Posted: April 28th, 2016, 4:49 pm
by Magikarpmaster629
*cough* Adi1008 or someone else please answer my questions *cough*
Re: Astronomy C
Posted: April 28th, 2016, 5:33 pm
by finagle29
Magikarpmaster629 wrote:Good luck at state, Adi! I hope to see you at nationals!
1. What type of diagram is this?
2. What data is plotted (what types of objects)?
3. Beta Pictoris b most likely belongs to what spectral class?
4. What do the green and pink lines represent, and which one does the data shown fit better?
5. How many times brighter is 2MASS-0103 AB b than HR 8799 b in the L' band?
1. This is a color-magnitude diagram.
2. The magnitude in the L' band (in the infrared range) versus the difference in magnitude between the H and L' bands of various cool stars (red dwarves and brown dwarves) and exoplanets.
3. Beta Pictoris b most likely belongs to spectral class L.
4. The green and pink lines represent different models for the formation of brown dwarves and large planets.  The green line fits the data shown better.
6. 2MASS-0103 AB b is about 23 times brighter than HR8799 b in the L' band.
Re: Astronomy C
Posted: April 28th, 2016, 5:58 pm
by Magikarpmaster629
finagle29 wrote:
1. This is a color-magnitude diagram.
2. The magnitude in the L' band (in the infrared range) versus the difference in magnitude between the H and L' bands of various cool stars (red dwarves and brown dwarves) and exoplanets.
3. Beta Pictoris b most likely belongs to spectral class L.
4. The green and pink lines represent different models for the formation of brown dwarves and large planets.  The green line fits the data shown better.
6. 2MASS-0103 AB b is about 23 times brighter than HR8799 b in the L' band.
All correct!
Re: Astronomy C
Posted: April 30th, 2016, 2:48 pm
by finagle29
1. What's special about the atmosphere of 2MASSJ22282889-431026?
2. How did astronomers come to this conclusion? What data/trends support this?
Re: Astronomy C
Posted: May 3rd, 2016, 2:09 pm
by Magikarpmaster629
finagle29 wrote:1. What's special about the atmosphere of 2MASSJ22282889-431026?
2. How did astronomers come to this conclusion? What data/trends support this?
1. It has different amounts of brightness at different altitudes
2. Using the Hubble and Spitzer space telescopes, they constructed two light curves in the optical and infrared spectra. Since the two telescopes were observing at different wavelengths, they were able to see different levels of the atmosphere.
Re: Astronomy C
Posted: May 3rd, 2016, 3:25 pm
by finagle29
Magikarpmaster629 wrote:
finagle29 wrote:1. What's special about the atmosphere of 2MASSJ22282889-431026?
2. How did astronomers come to this conclusion? What data/trends support this?
1. It has different amounts of brightness at different altitudes
2. Using the Hubble and Spitzer space telescopes, they constructed two light curves in the optical and infrared spectra. Since the two telescopes were observing at different wavelengths, they were able to see different levels of the atmosphere.
Almost... key word is "conclusion" not just the data.